Abstract: A biomimetic projector (BioP) based on computerized tomography of pygmy sperm whale's biosonar system has been designed using gradient-index (GRIN) material. The directivity of this BioP device was investigated as function of frequency and the velocity gradient of the GRIN material. A strong beam control over a broad bandwidth at the subwavelength scale has been achieved. Compared with a bare subwavelength source, the main lobe pressure of the BioP is about five times as high and the angular resolution is one order of magnitude better. Our results indicate that this BioP has excellent application potential in miniaturized underwater sonars.
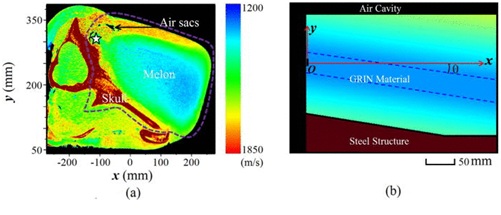
FIG. 1. (a) Sound speed distribution of a pygmy sperm whale's head based on the CT image. The region bounded by dashed lines represents the acoustic path area, which includes the air sacs, melon, and skull. (b) The design of the BioP, which includes an air cavity to mimic the air sacs, the GRIN material to mimic the melon, and the steel structure to mimic the skull. The sound channel angle θ θ is the angle between the channel of the lowest sound velocity and the x axis.
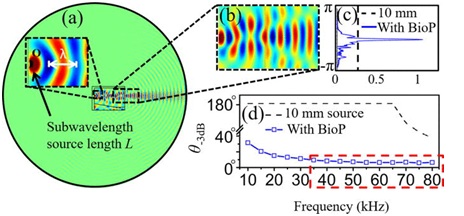
FIG. 2. (a) Simulated acoustic wave propagation produced by the BioP, where the subwavelength line source length Lis 10 mm and the frequency f is 33 kHz. The sound channel angle θ equals to 0°. (b) The enlarged figure of acoustic wave propagation in the GRIN and emitted from the BioP. (c) The normalized absolute acoustic pressure distributions of the BioP and the bare subwavelength line source. (d) The frequency responses of the half-power beam width θ−3dB of the BioP and the bare subwavelength line source.
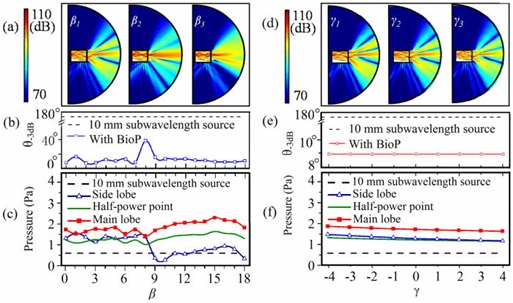
FIG. 3. (a) The sound pressure level distribution of the BioP withβ = 0, 15, and 19, respectively. (b) The dependence of the half-power beam width θ−3dB of the BioP and the subwavelength source on β. (c) The dependence of the main lobe pressure, side lobe pressure, half-power point pressure of the BioP, and the subwavelength linear source on β. (d) The sound pressure level distribution of the BioP with γ = −4, 0, and 4, respectively. (e) The dependence of the half-power beam width θ−3dB of the BioP and the subwavelength source on γ. (f) The dependence of the main-lobe pressure, side lobe pressure, half-power point pressure of the BioP, and the subwavelength linear source on γ.
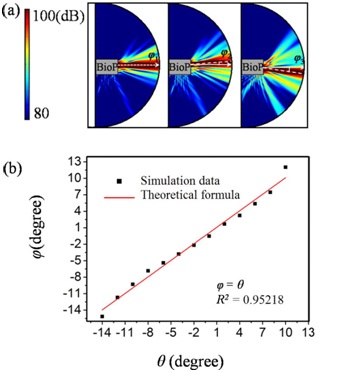
FIG. 4. (a) The sound pressure level distributions of the BioP with different sound channel angles, θ=0°, 4°, and −8°, respectively, where the line source length L is 10 mm and the frequency f is 48 kHz. (b) The agreement between the theoretical prediction φ=θ and the simulation data, where the red line is the theoretical prediction of φ=θ and the dotted points give the simulation data.
Citation:Gao X, Zhang Y, Cao W, et al. Acoustic beam control in biomimetic projector via velocity gradient[J]. Applied Physics Letters, 2016, 109(1):013505.
Link to full text:http://aip.scitation.org/doi/full/10.1063/1.4955179
